Journal Publications Network
Problem Statement
Problem Statement
This project was our final project for our Computing for Analytics course. We were tasked with selecting a network dataset to apply 5 of the algorithms that we learned in this class. Our dataset comes from the Stanford Large Network Dataset. The dataset is a directed paper citation network that covers all the citations of the 27770 papers (nodes) with 352807 citations (edges).
Clustering
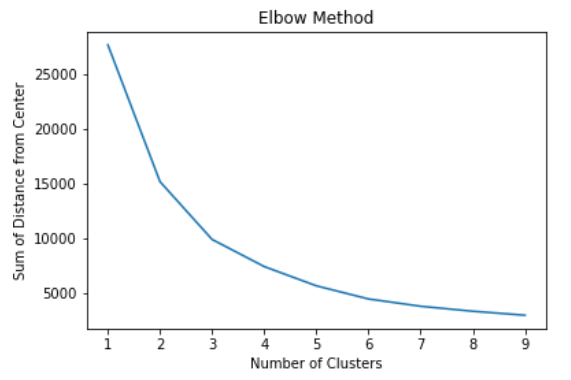
Clustering In this dataset, a cluster could represent a sub-discipline within the high-energy physics theory field. The reasoning behind the clusters’ representation is that if papers are in the same sub-field, their characteristics must be also similar, which is represented in the distance between the nodes. In addition, papers in the same sub-field will tend to reference each other more than other sub-fields. We used k-means clustering to form the clusters as well as the elbow method to decide on the number of clusters.
Betweenness Centrality
In this dataset, centrality would be a way to measure the influence of the paper. We decided to use centrality scores within each cluster to find the most influential paper in each sub-discipline. We assumed that the most influential papers would be the ones cited in multiple different types of papers. This assumption is what allowed us to use betweenness centrality as a proxy measure of influence.
Depth-First Search
The next thing we were interested in was what we called prolific papers. A prolific paper would be one that spawned many other papers and presented an idea that was continuously developed upon. We assumed this type of paper would produce the greatest number of successor nodes. A depth-first search was used as a proxy for this by getting the depth of a family produced by each paper.
Longest Path
We wanted to see if we could predict which papers were on the cutting edge of their field. We reasoned that a paper's distance from the central node of the cluster would be a good proxy measure of the cutting edge. To find these values, we used Dijkstra's longest path algorithm. We ran into some issues with our graph being cyclical, which we assumed could not happen. We found out that some papers referenced each other, so we trimmed the graph of all cycle connections.
Linear Program
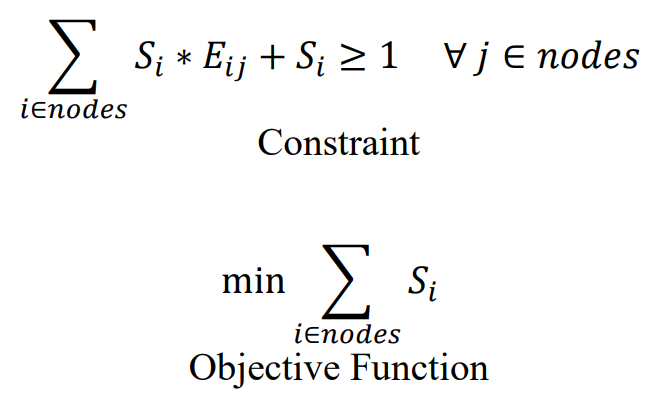
Another insight we wanted to pull was the minimum number of papers someone would need to read to get an understanding of a particular subfield as a whole. We only wanted to focus on "important" papers, which we defined as being cited at least 10 times. After trimming out each cluster to just those papers, we set up an LP with PuLP. An interesting note, this collection of nodes is referred to as a minimum dominating set. A dominating set is a set of nodes that allows you to travel to any other node in the network.
Things I Would Do Differently
Looking back at this project, there are a few things that don't sit well with me.
First is the number of clusters we choose for k-means. Looking at the graph now, it really looks like the number of clusters should be 3 from the elbow method.
This is made even more apparent when looking at the names of the main papers from clusters 1 and 4.
In regards to our method of finding cutting-edge papers, I think time should have been incorporated into that analysis.
Some of the papers with the longest paths could have been older dead ends.
We had access to the metadata for each node, but we were on a deadline and had to choose what to focus on and what to cut out.
It would have been great to see if we could have followed up with the papers we identified in the future to see if they really became important to the field.

